 There are two schools of thought when it comes to fishing. Some would argue that fishing is a highly skilled endeavor, and a trained and expert fisherman will almost certainly catch more fish than the rank amateur equipped with his Zebco 202. Others would argue that fishing is mostly luck, and what happens when the lure hits the water is really beyond all human control. Might as well kick back, open a cold one and turn on the ball game while occasionally eyeing that bobber at the edge of the reeds.
But both sides of the argument should agree on this fact: if there aren’t any fish in the water, then the expert and the amateur are going to catch the same number of fish.
So it goes with betting longshots at a racetrack. (I define a “longshot” as a horse with off odds at 10-1 and above). Some handicappers believe that longshots can be uncovered through extensive research and analysis, panning for “gold” like a prospector in the Wild West sifting out the losers and the chalk. Others prefer to play longshots based on their odometer reading when they pull in the parking lot that day, assuming matter-of-factly that the big prices simply defy all logic and reason.
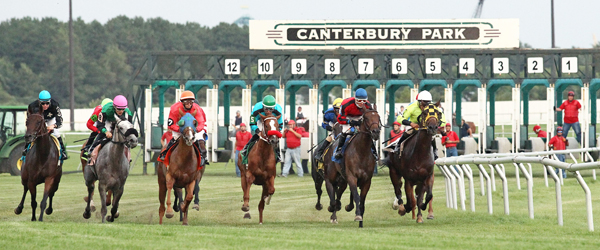
Betting longshots at Canterbury Park over the first two weeks of the 2013 meet felt a lot like fishing in a desert oasis. The longshots simply were not finding the winners circle, and therefore didn’t exist except as fool’s gold.
Below is a breakdown of the winning odds of the 56 thoroughbred races run so far in 2013, as well as a comparison to the previous years’ data for Canterbury Park.
Canterbury Park 2013
Off Odds Winners/Starters ROI Win %
0.1-1.4 13/27 = 48% 0.92 23%
1.5-3.4 24/80 = 30% 1.03 43%
3.5-5.9 11/70 = 16% 0.78 20%
6.0-7.9 3/28 = 11% 0.83 05%
8.0-9.9 4/42 = 10% 0.94 07%
10.0-14.9 1/63 = 2% 0.19 02%
15.0-19.9 0/34 = 0% 0.00 00%
20.0-99.9 0/89 = 0% 0.00 00%
Canterbury Park Past 365 Days
Off Odds Winners/Starters ROI Win %
0.1-1.4 134/265 = 51% 0.96 28%
1.5-3.4 182/668 = 27% 0.92 37%
3.5-5.9 90/575 = 16% 0.84 19%
6.0-7.9 29/281 = 10% 0.80 06%
8.0-9.9 15/267 = 06% 0.55 03%
10.0-14.9 16/476 = 03% 0.43 03%
15.0-19.9 8/331 = 02% 0.45 02%
20.0-99.9 10/970 = 01% 0.36 02%
It’s instructive to note how similar these two charts are. For example, horses at off odds < 6-1 won 84% of the Canterbury races over the past 365 days, and 86% of the races so far in 2013 (7 days). Eliminate those 6-1 and above horses and you will be looking at a smaller contender group that will give you the winner in six out of seven races if the trend goes forward. In other words, the Volatility Index at Canterbury Park is very low!
Also, horses at final odds of 10-1 and above are a meager 1 for 186 so far this year. (No fish in the deep water!) That is an unsustainably low number that will definitely improve as the year progresses, as last year there were 34 winners that paid 10-1 or above (7% of the total winners).
No matter what school of thought you believe in, let’s hope the “fish” start biting soon!
This blog was written by Canterbury Regular “The Oracle”. The Oracle is a longtime Minnesota race fan that has handicapped Canterbury’s races religiously for more than 20 years. He writes about handicapping and statistical trends in Canterbury’s races.
Photo Credit: Coady Photography
