 “Money, horse racing and women, three things the boys just can’t figure out” – Will Rogers (1879-1935)
The above quote attributed to American entertainer and humorist Will Rogers was uttered in a different era. It was an era where news traveled slowly. There were no computers, no iPhones, and no internet. It was an era before the information explosion.
It was also an era where a pacing racehorse named Dan Patch was the most popular athlete in America, drawing crowds on occasion in excess of 100 thousand people. And despite the fact that pari-mutuel wagering hadn’t yet been introduced in the United States, I’m quite certain that each patron poised to witness another Dan Patch world record knew deep down that the race favorite only emerged victorious approximately one-third of the time. Because that’s the way it has always been.
Or has it?
Fortunately for us, in 2013 we do live in the information age. We can compile large quantities of data and use computer analysis to draw sound statistical conclusions. The larger the sample size, the more likely the conclusions drawn will carry forward. So let’s look at some horse racing data regarding the wagering favorite and see what it shows:
In the last 365 days, there were 36% winning favorites for all thoroughbred races in the United States.
This number has indeed remained relatively consistent over the years, despite the fact that there is more information available now than ever before. The crowd from the Dan Patch era would be laughing (probably at us, not with us).
So how do favorites at Canterbury Park compare to the national average? The chart below shows a breakdown of the local favorites for a 30 day period and a 365 day period.
Win % 30 days Win% 365 days
All Thoroughbred Races 39% 41%
Allowance/Stake 41% 44%
Claiming 37% 39%
Maiden Special Weight 25% 31%
Maiden Claiming 53% 52%
Colts/Geldings 33% 41%
Fillies/Mares 46% 41%
Open Company 36% 38%
Minnesota Bred 45% 49%
Fast Track 41% 44%
Off Track 37% 38%
Turf 29% 34%
Sprints 35% 42%
Routes 46% 40%
Take a look at the above chart and look for patterns. What types of races are giving the public trouble? Where is the public dialed in? What would Will Rogers say if he saw this chart?
My guess is he would think “the boys” still haven’t got it figured out.
But that’s the challenge of the game.
This blog was written by Canterbury Regular “The Oracle”. The Oracle is a longtime Minnesota race fan that has handicapped Canterbury’s races religiously for more than 20 years. He writes about handicapping and statistical trends in Canterbury’s races.
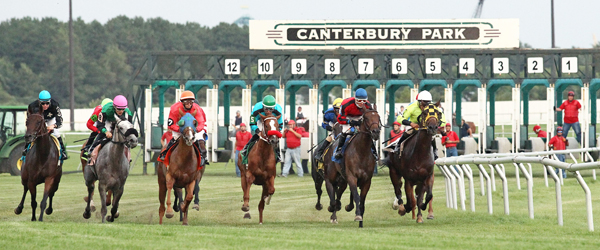
Photo Credit: Coady Photography